MIDB Precision Brain Atlas


Welcome to the MIDB Precision Brain Atlases website. Here you will find a set of probabilistic functional atlases derived from multiple studies that can be used to explore network topography. These atlases were derived using data from multiple methodologies at the DCAN labs and collaborators. Feel free to explore, download data, and provide feedback.
The MIDB Precision Mapping Brain Atlas
Explore atlases derived from personalized brain topography
The MIDB Precision Mapping Brain Atlas (MPMA) was created to support investigators in leveraging individual brain topographies to assist in characterizing various aspects of brain function and to aid in honing methods in medical discovery.
The MIDB Atlas consists of two derived atlas types and four sub-atlases:
Topographic Atlases:1) A Single Subject Topographic Atlas: Consisting of single subject precision network maps
2) A Group Probabilistic Atlas: Consisting of Network based probabilities and associated regional parcellations
Integration Zone Atlases:
3) A Single Subject Integration Zone Atlas: Consisting of single subject precision integration zone maps
4) A Group Integration Zone Atlas: Consisting of group averaged integration zones
The MPMA is a community resource and is designed to house precision brain atlases from multiple sources and using multiple methods. To include your own version of a Topographic or Integration Zone Atlas, please contact dcanlab
Every Brain is Unique
Brain function can be measured noninvasively using different techniques, including functional MRI. The precise spatial configuration of connections of each brain region is established through a combination of developmental factors, genetics, and each person’s lived experience. Neuroscientists have realized that by looking at coactivation patterns of brain connectivity, one can delineate brain areas that share similar functions. Such functional brain areas have correspondence with brain areas delineated using more invasive approaches, such as injecting viruses. Neurons self-organize into networks in an effort to make sense of organism-environment interactions. Perhaps unsurprisingly, emerging evidence suggests that the precise topography of each person’s networks is fairly unique.Definitions:
- Network : A network is an interconnected collection of neural elements (for example, populations of cells) and the connectivity between the elements. A brain network may contain more than one brain area and the constitutive brain areas might be distant in the brain. Examples of networks include the motor, visual, and dorsal attention systems.
- Integration Zone : A brain region whose connectivity profile is within more than one network.
How is an individual’s brain network defined?
Each study uses a different method of identifying neural network in an individual (e.g. infomap community detection, template matching, or non-negative matrix factorization). Users are encouraged to peruse the primary literature provided with each data set.
Read about the full details of the template matching procedure here: Hermosillo et al (2022) - A Precision Functional Atlas of Network Probabilities and Individual-Specific Network Topography
Individual-specific map example
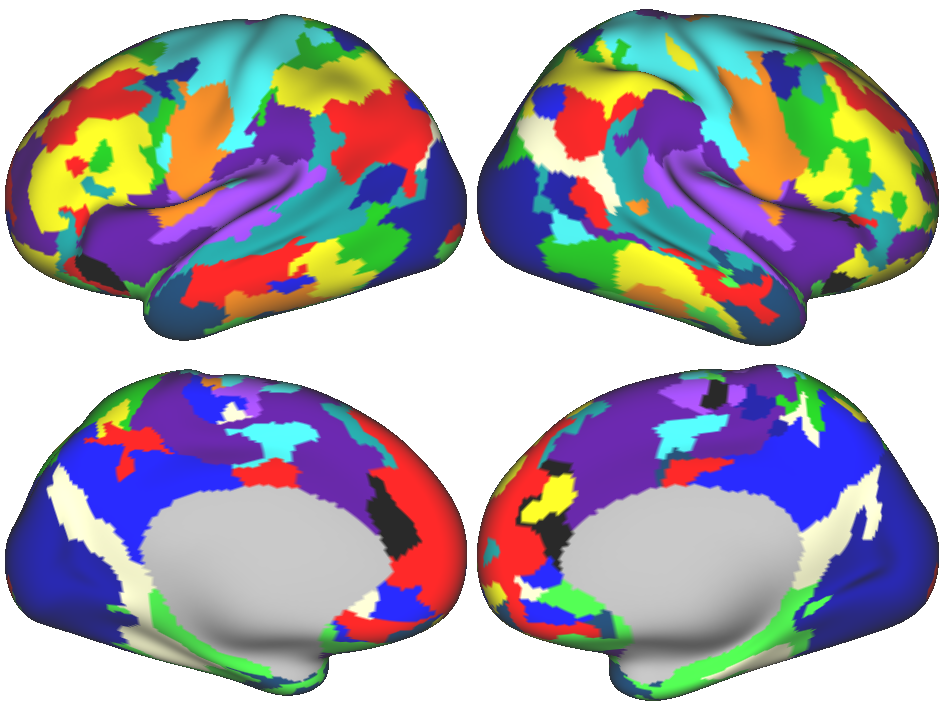 In the figure above, each grayordinate belongs to one network. Each color represents a unique network. Brain surfaces are inflated for visualization purposes.
Networks were identified from data acquired by the Midnight Scan Club.
Midnight Scan Club.
Probabilistic map of the Default Mode Network
Using many individual-specific maps shown above, we can generate probabilistic network maps. Probabilistic maps represent the proportion of the population that has a given network at each grayordinate. Here we show the DMN as an example.
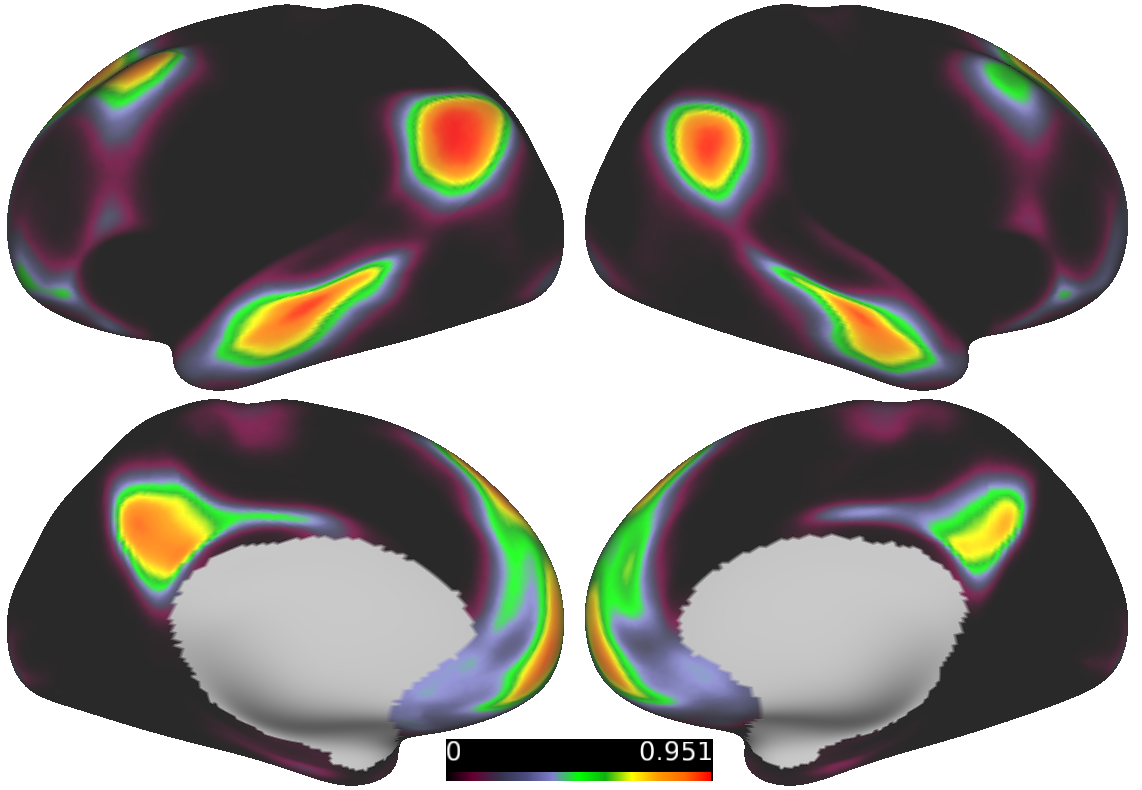 In the figure above, each grayordinate has probability of being assigned to a given network. Warmer colors indicate a higher probability,
cooler colors indicate a low probability.
Some brain regions may belong to multiple networks
A variation of the identifying individual-specific networks, overlapping template matching, allows networks to overlap. That is to say, it is possible, and likely that some brain regions participate in multiple networks.
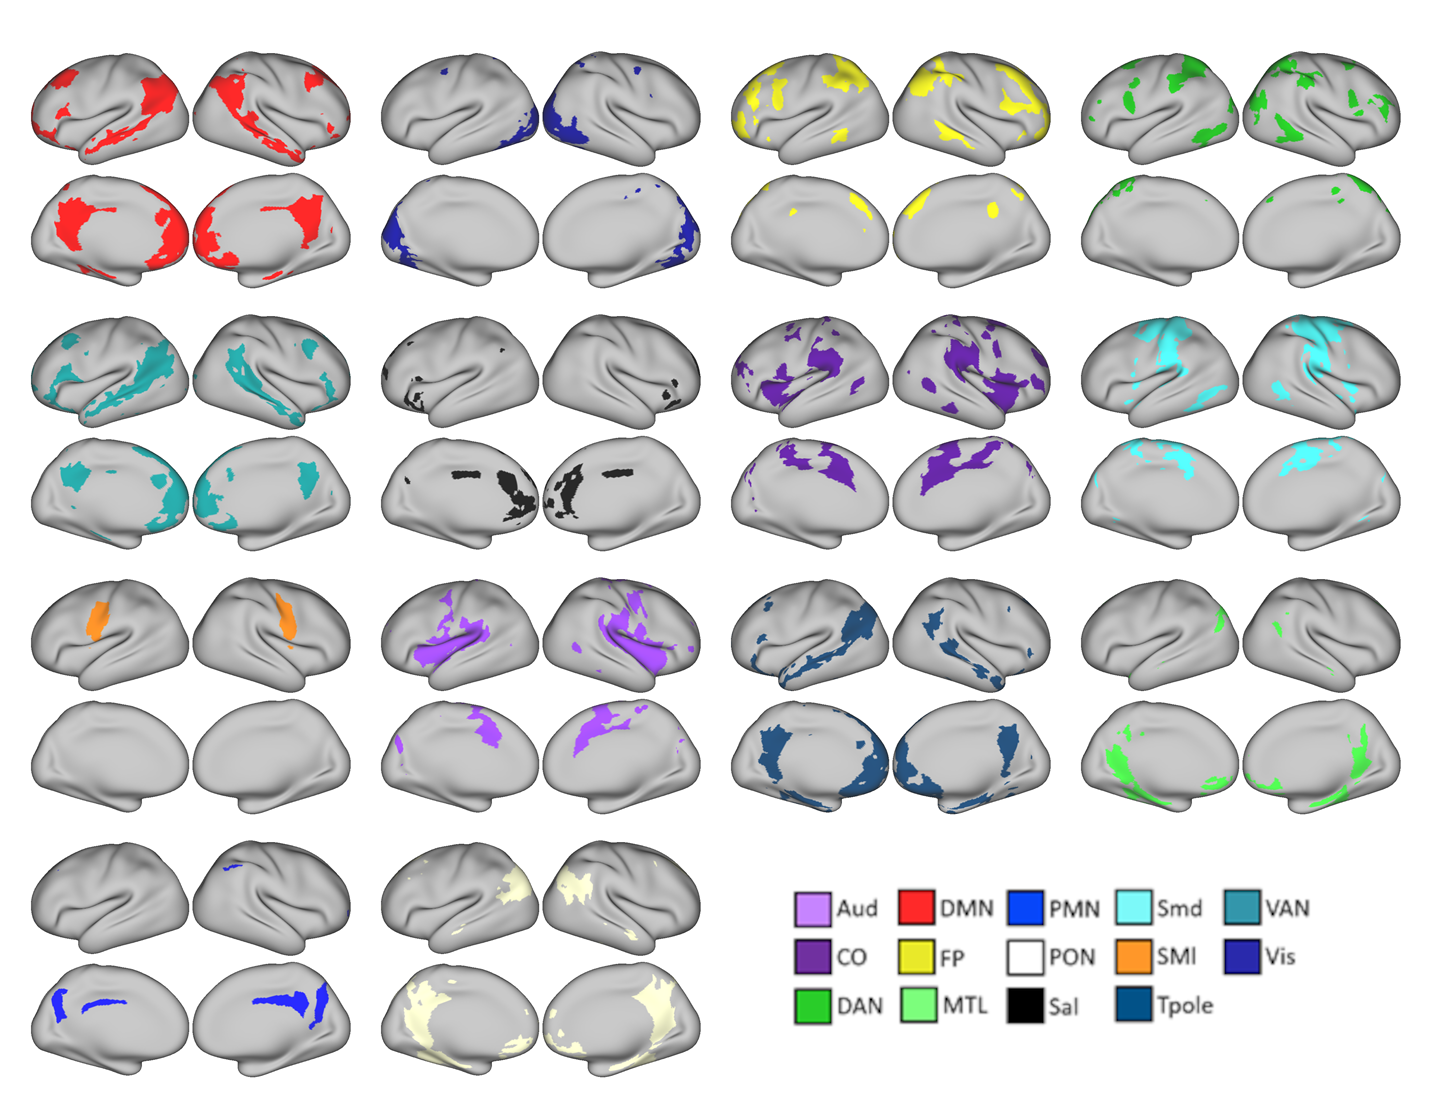 In the figure above, each grayordinate can belong to multiple networks. Each color represents a unique network.
Networks were identified from data acquired by the Midnight Scan Club.
As one can see in the image above, some brain regions, such as the posterior cingulate gyrus and the posterior parietal cortex appear to participate in multiple networks. When networks overlap, we can identify brain regions that have the most numerous overlapping networks in an individual. By averaging across the population, we can identify consistent regions of network overlap.
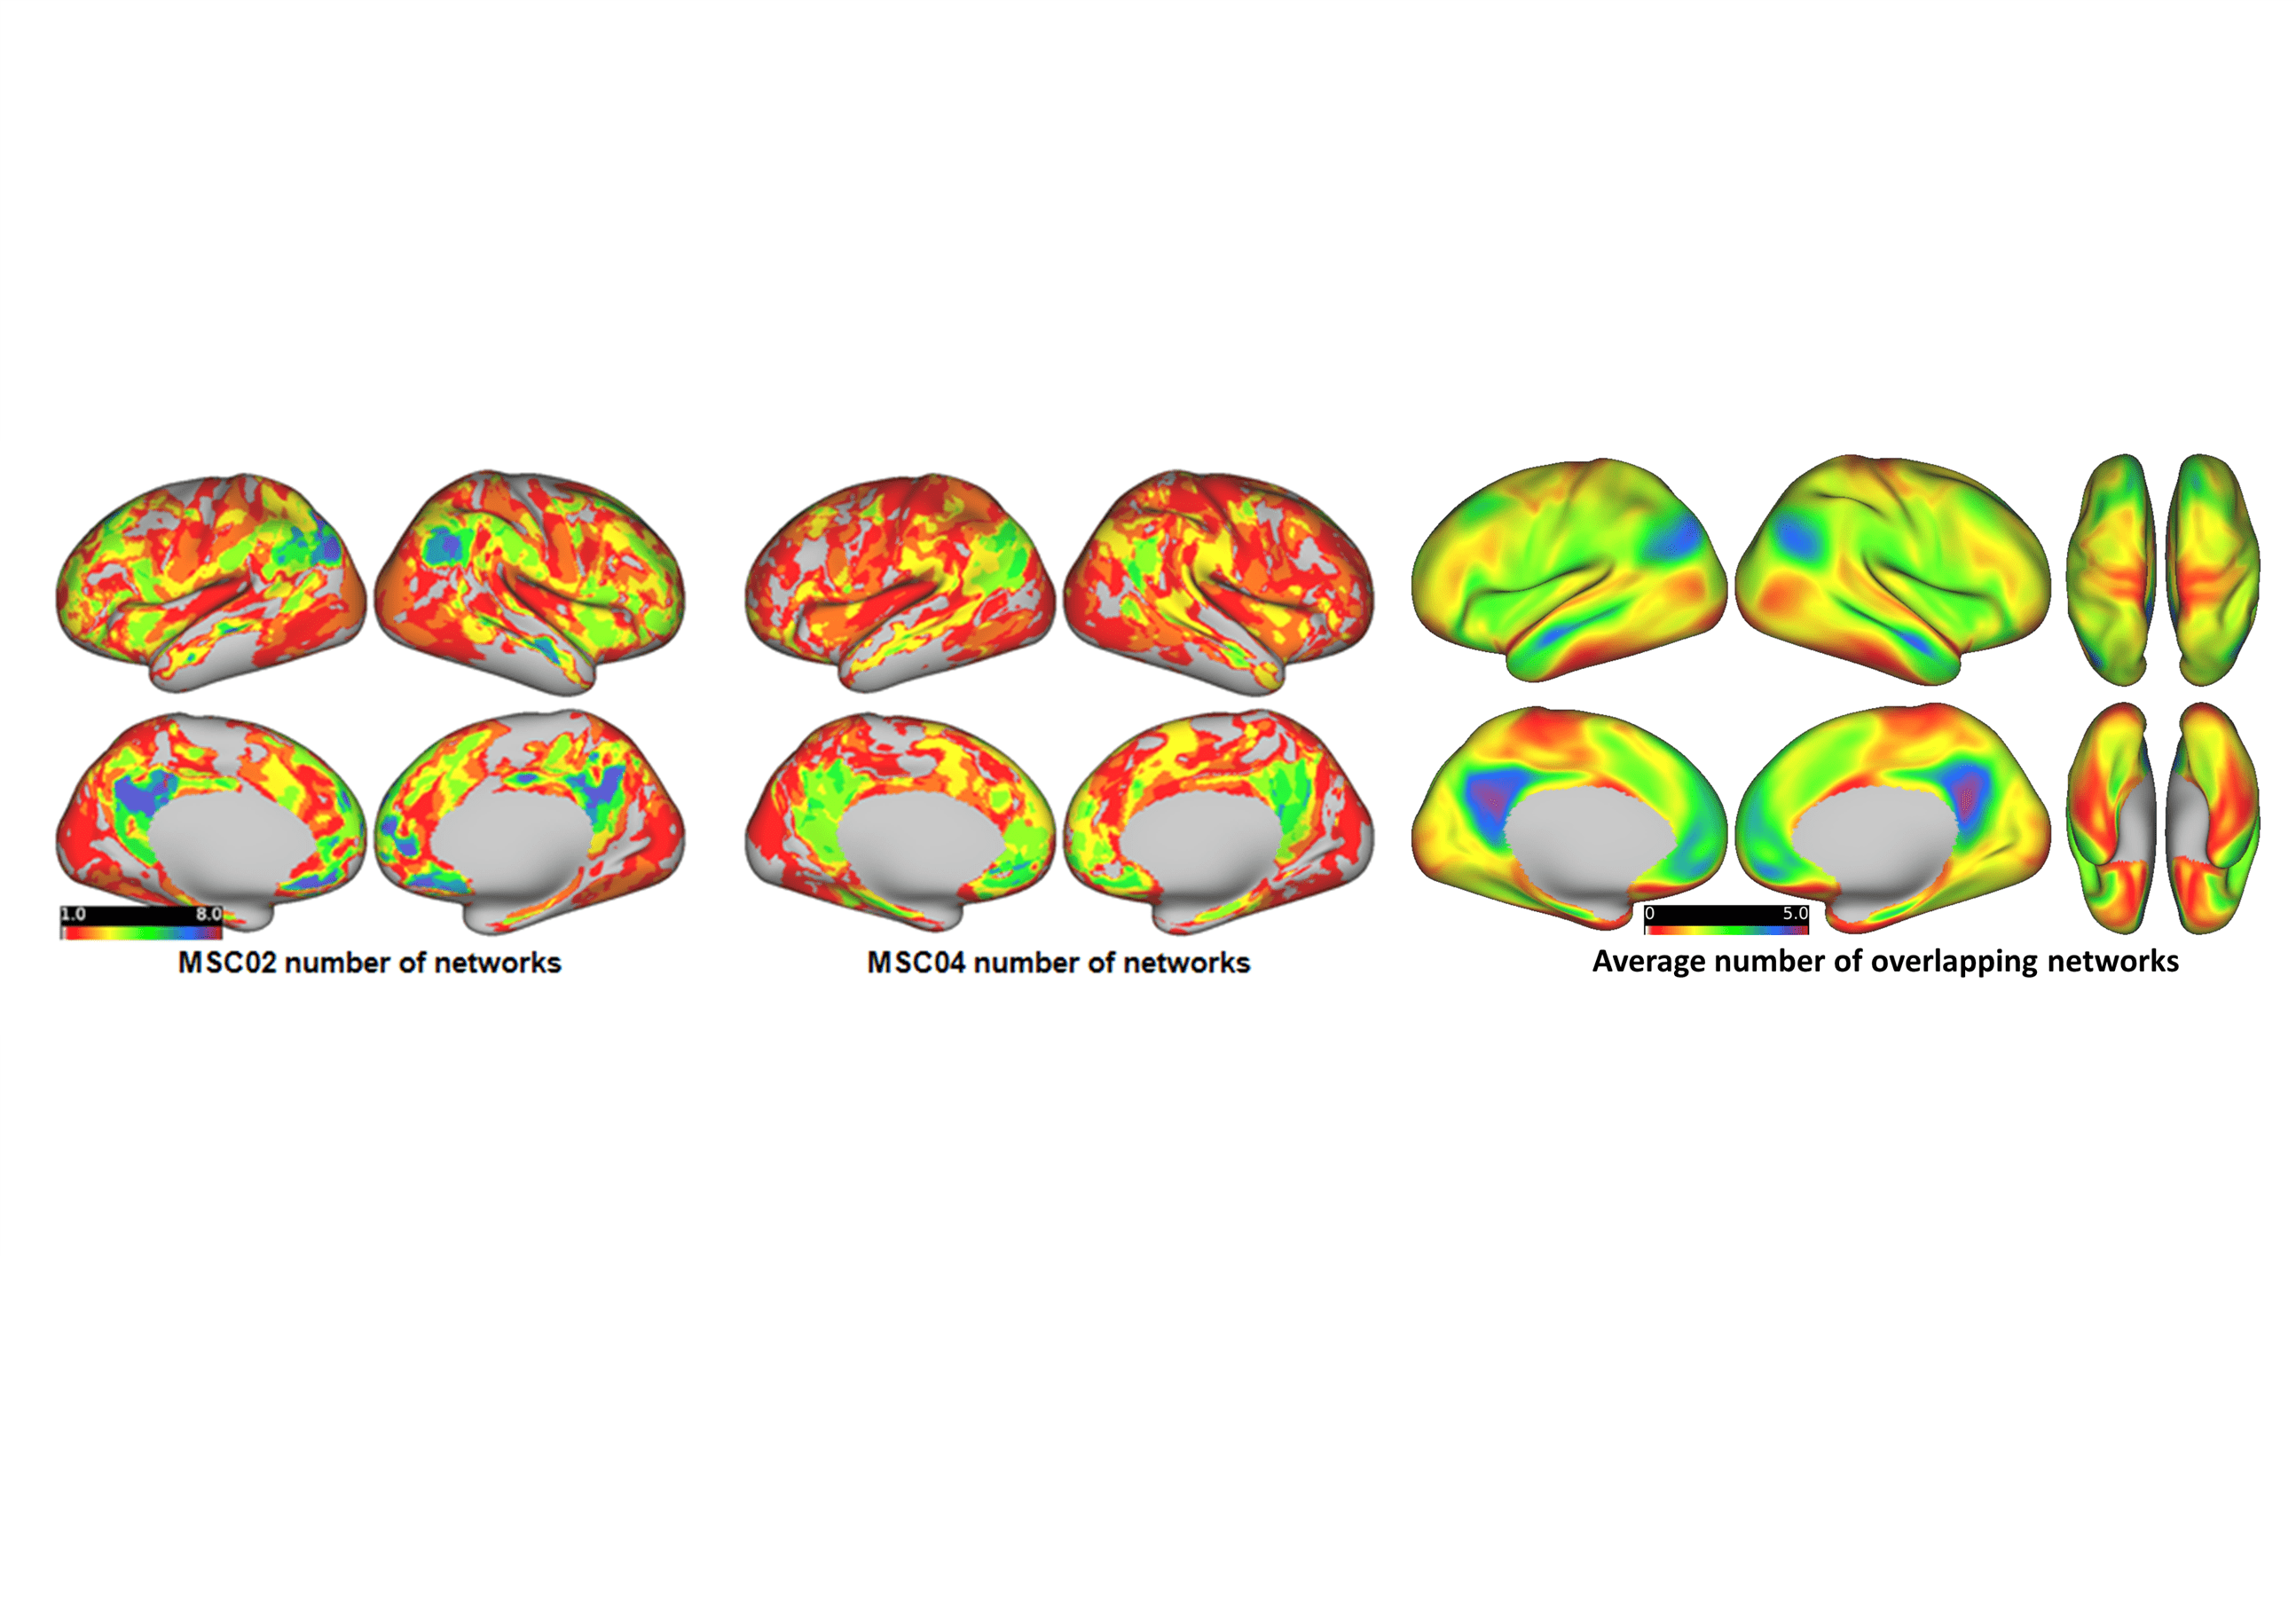 In the figure above, on the left and center panels are the number of networks that overlap at every grayordinate for two different participants
from the Midnight Scan Club. On the right is the average number of networks that overlap at any given region from using the ABCD study.
Integration Zone regions
Using the map of the average number of networks shown above, we generated a region set from regions that participate in the most networks. Below, we are displaying all surface brain regions that belong to more than 2.3 overlapping networks.
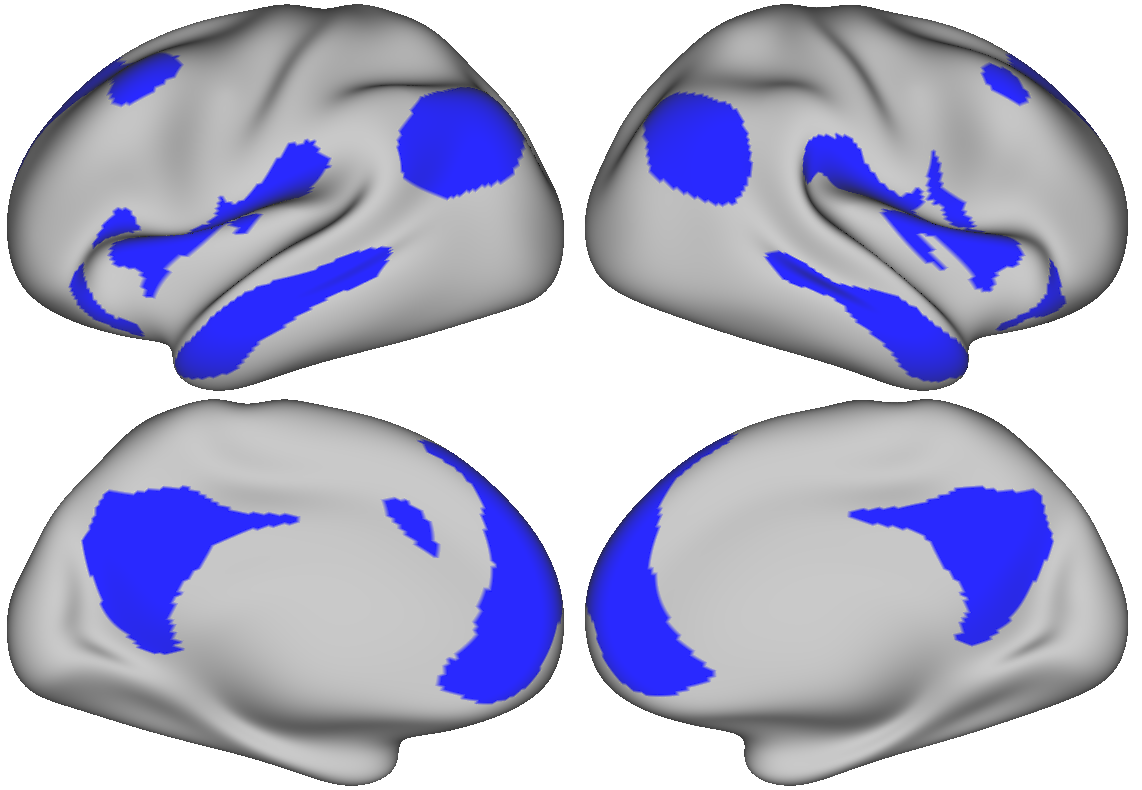 For an integration zone region-of-interest set, the blue regions shown above indicate where multiple networks overlap.
How were the atlases generated?
The MIDB Probabilistic atlases are a collection of network atlases, each constructed by calculating the probability of observing a given network of multiple individual brain maps. Currently, probabilistic maps are provided as .dscalar.nii and labels files are provided as .dlabel.nii files. (Refer to humanconnectome workbench)
Why use the MIDB atlas?
- Reliably measure group brain-behavior relationships
- Individual participants within a group show topographic variations in their networks. The use of probabilistic atlases more precisely measures individual variation that contributes to spatial heterogeneity of a network. This enables investigators to more reliably measure group brain-behavior relationships.
- Established probabilistic network locations:
- Investigators who are specifically interested in characterizing the behavior of a particular network can use the MIDB probabilistic atlas label files established in a large group to confidently measure which network is being activated in an independent sample.
- Targeting in brain stimulation:
- The MIDB probabilistic atlases can serve as a stereotactic target for brain stimulation when collection of low-motion resting state fMRI data is not possible.
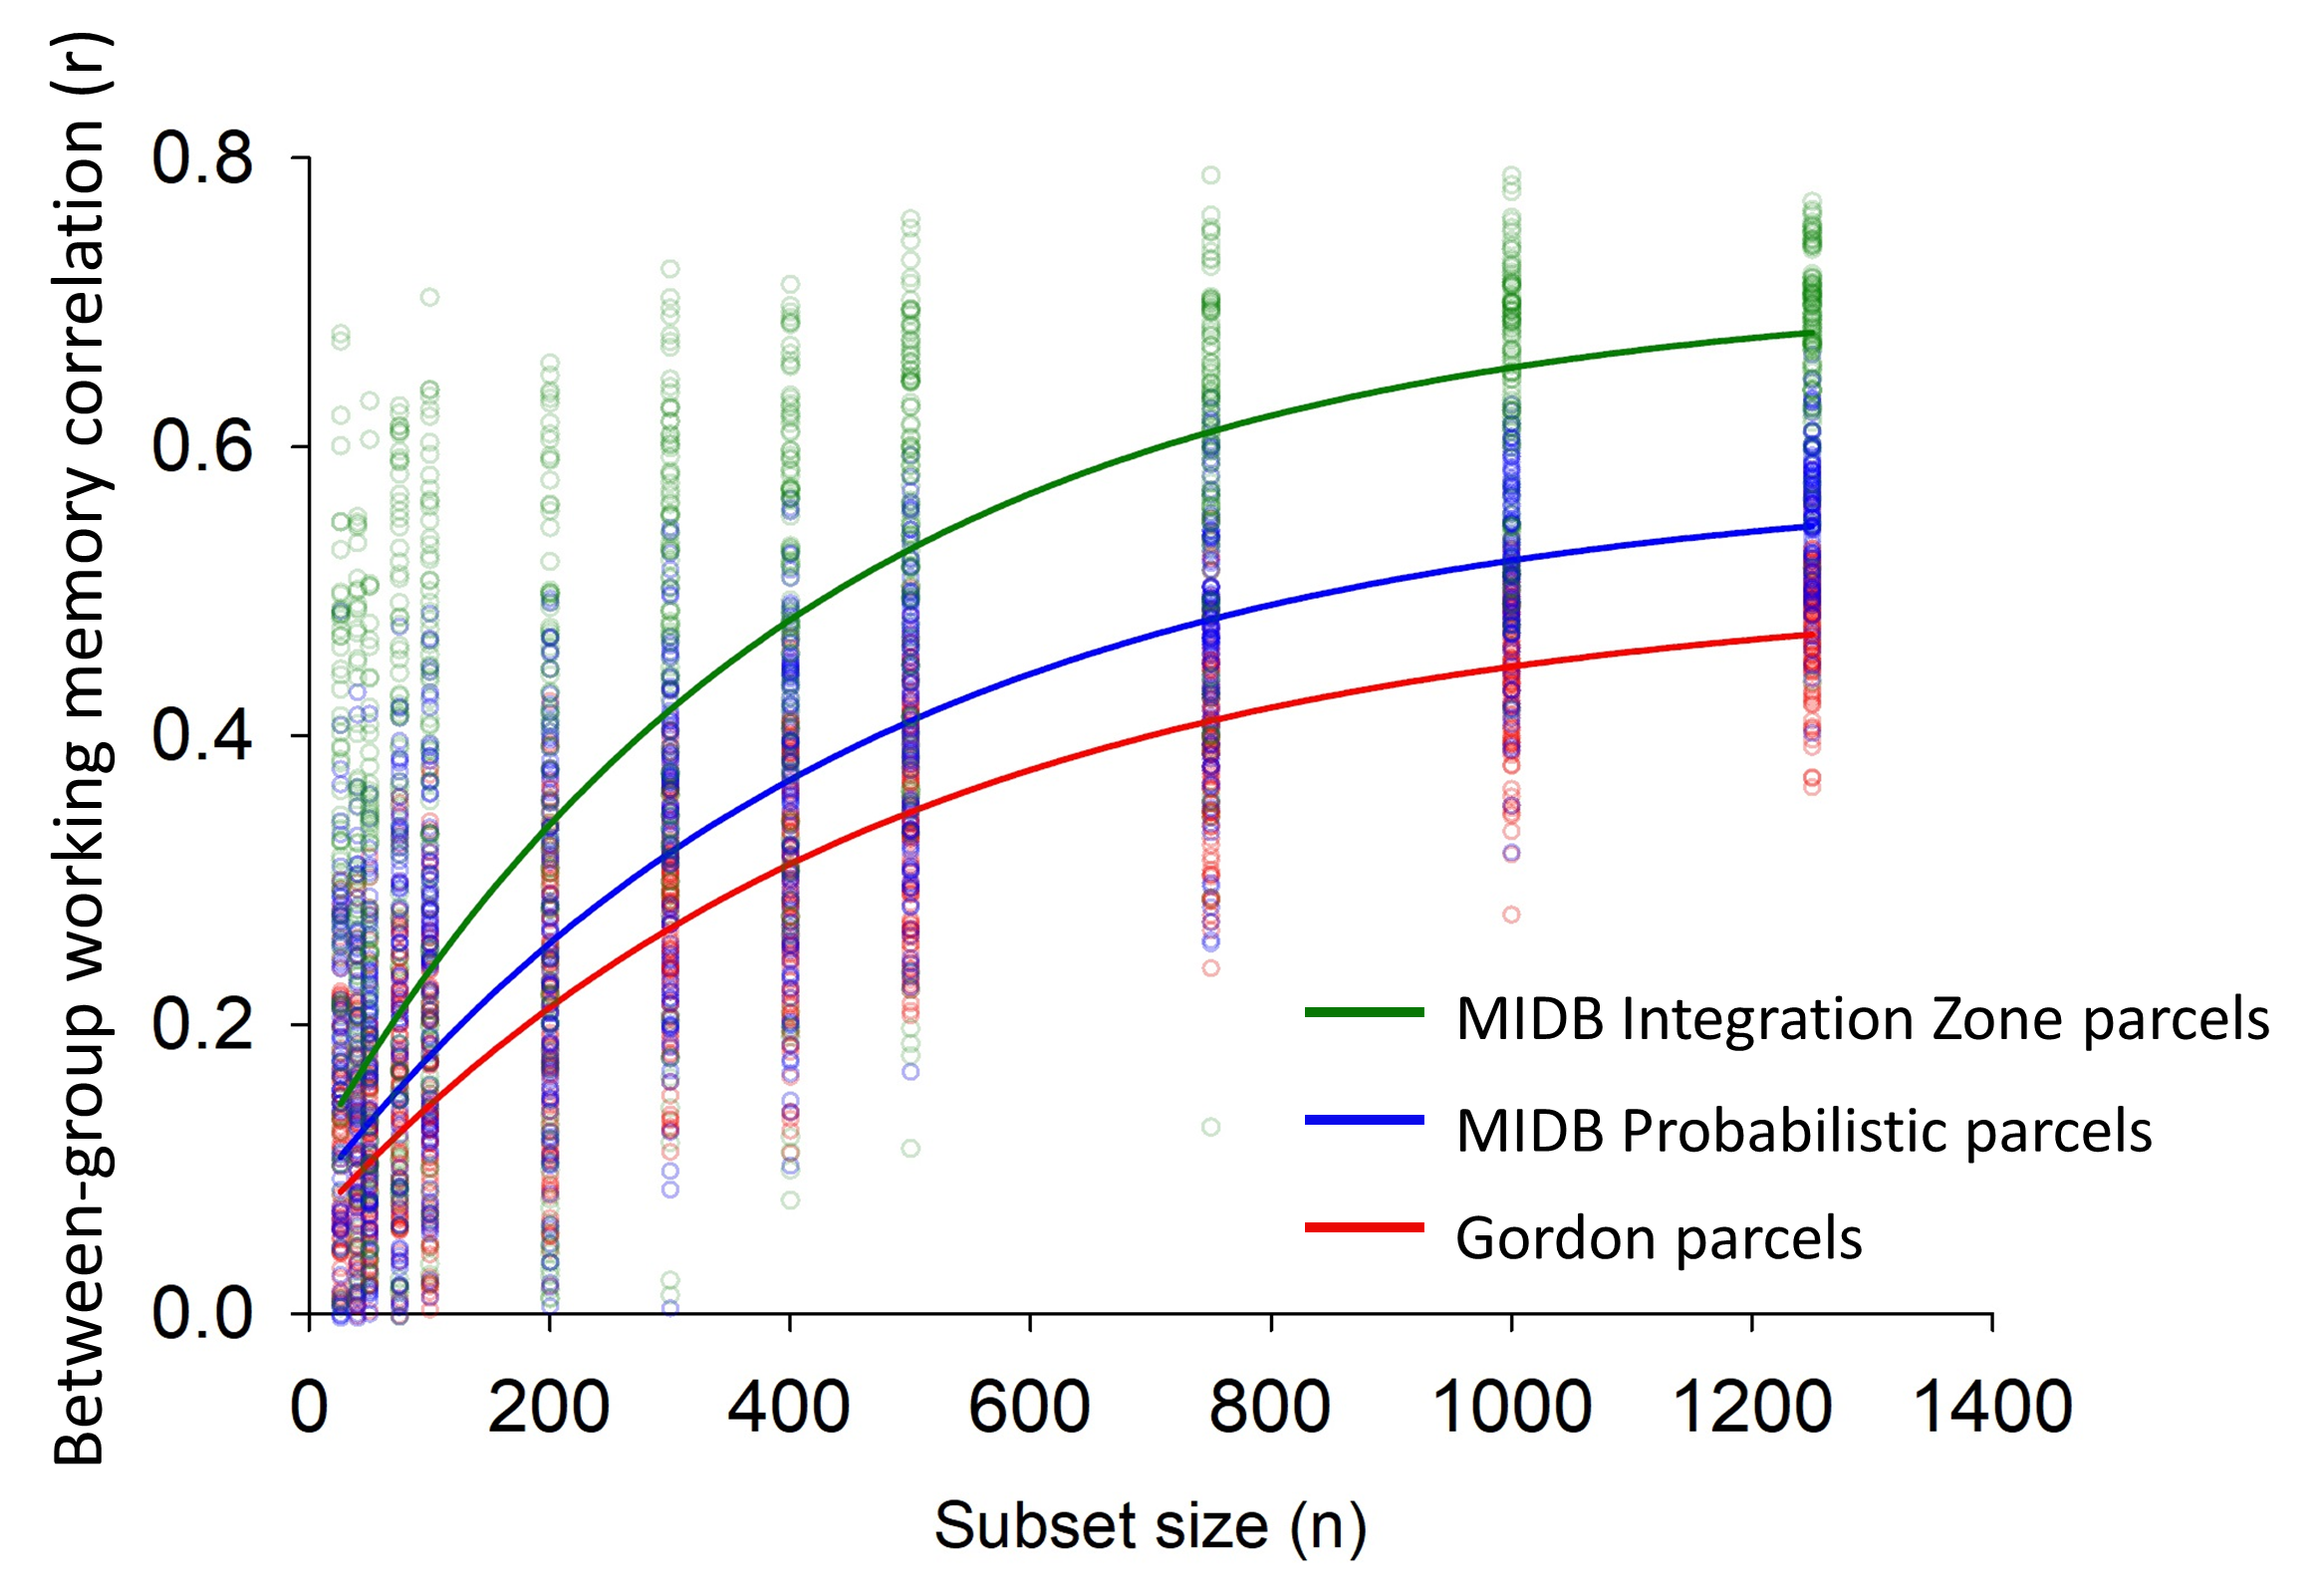 In the figure above, we used a subset reliability analysis showing that using the MIDB probabilistic parcellation and MIDB Integration Zone parcellation
(generated from ABCD data) improves signal-to-noise in group-level predictions relative to the Gordon Parcellation. Blue circles indicate inter-group
correlation for each random subset using the MIDB probabilistic parcellation. Red circles indicate inter-group correlation for each random subset using
the Gordon parcellation.
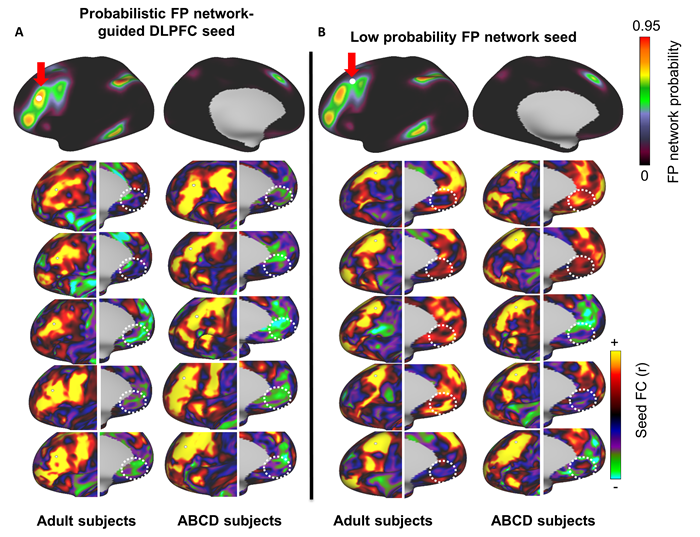 In the figure above, a seed based correlation was conducted with 5 MSC and 5 ABCD subjects. A) A seed was placed at the DLPFC (as defined by the MIDB Frontoparietal
probabilistic map) and connectivity to the subgenual cortex was calculated (dotted white circles). Note that, in most subjects, the connectivity to the frontoparietal
network was anti-correlated with the subgenal cortex (green-blue). B) When the seed was placed in a region with a low probability of belonging to the frontoparietal network,
connectivity to the subgenual cortex was inconsistent. White circles indicate the location of the subgenual gyrus (subgenal MNI coordinates=±5, 25, -10). While this analysis,
of course, uses resting state data, if no resting state data is available for a participant, targeted brain stimulation can be conducted with the MIDB Probabilistic maps.
Resources
- Studies
- Code Repositories
- Template Matching
- ABCD-HCP BIDS fMRI Pipeline
- NDA Collection 3165 ABCD-BIDS Downloader
- XCP-ABCD: A Robust Postprocessing Pipeline of fMRI data
- Data Repositories
- Open Science Platforms
- Additional Reading
- HCP Processing Pipeline
- Adolescent Brain Cognitive Development (ABCD) Community MRI Collection and Utilities
- Precision Functional Mapping of Individual Human Brains
- The Adolescent Brain Cognitive Development (ABCD) study: Imaging acquisition across 21 sites
- Probabilistic mapping of human functional brain networks identifies regions of high group consensus
- Individual Variation in Functional Topography of Association Networks in Youth
Please visit the dcanlab website for any general questions.
© Copyright 2020-2021 : Robert Hermosillo, Jim Fair
Copyright & License Notice The MIDB atlas images and associated files are copyrighted by the Regents of the University of Minnesota. It can be freely used for educational and research purposes by non-profit institutions and US government agencies only. Other organizations are allowed to use The MIDB atlas only and will require prior approval. The images and software may not be sold, reproduced, or redistributed without prior written approval.
As unestablished research software, these files are provided on an "as is'' basis without warranty of any kind, either expressed or implied. The downloading, or usage of any part of this software constitutes an implicit agreement to these terms. These terms and conditions are subject to change at any time without prior notice.
Website design by Jim Fair
- Add Study
- Remove Study
- Update Study
- Website Stats
- Download Documentation
- Update Maps
- View Maps
- Encrypt Tool
- Config
| ADD A STUDY | |
|---|---|
| Displayed Study Name | |
| Study Folder Name - Study Id | |
| Study Prefix | |
| Available Data Type | |
| Enter Available Networks | |
| Network Display Name | |
Adding A Study
- The sufrace zip and volume zip files must contain a specific folder structure for the add study process to complete successfully.
- Refer to the Add Study doc on how to create a surface zip or volume zip file
(click the Download Docs button to download the Add Study document) - The folders.txt file specifies what type of Single Networks are available. It specifies the display names and folder names that the data reside in. For more detail refer to the Add A Study doc.
- Each added study requires between 4 and 5 GB of disk storage on the server for surface data, and equal storage for volume data. Be sure to check hard disk availability before adding a study. If sufficient storage is not available, an error message will be returned when creating a study.
- After adding a study, refresh the browser page to see the new study menu.
Uploading Files...Uploading Files...
Add Study In Progress...

And Updating Menu Configs
Please Wait
(this may take a few minutes)
DO NOT CLOSE BROWSER UNTIL COMPLETION MESSAGE RECEIVED
| REMOVE A STUDY | |
|---|---|
| Select Study To Remove | |

Please Wait
| UPDATE A STUDY | |
|---|---|
| Select Study | |
| Select Action | |
Uploading file
Update Study In Progress...

And Updating Menu Configs
Please Wait
(this may take a few minutes)
Update Study In Progress...

Please Wait
Updating A Study
- Adding/Updating volume or surface data will overwrite any existing data
- Refer to the Add A Study doc on how to create a surface.zip or volume.zip file
(click the Download Docs button to download the Add Study document - For volume or surface data, the Single Network folder names in the zip file must
match what already has been previously uploaded when the study was first added.
To change the names or add/subtract folders you must remove the study and add it
again with the new changes. Refer to the doc on Add A Study for more detail. - Adding volume or surface data to an existing study requires an additional 4 to 5
GB of data storage. Be sure to check available disk storage before adding data. - After updating a study you must refresh the browser page to see the new data
View Web Traffic Data
| Hit Count | Time Stamp | IP Address | City | State | Country |
|---|---|---|---|---|---|
| This is the footer | |||||
| First Name | Last Name | Email Address |
|---|---|---|
| This is the footer | ||
| Time Stamp | File Name | Study | IP Address | Email Address | City | State | Country |
|---|---|---|---|---|---|---|---|
| This is the footer | |||||||
| Time Stamp | IP Address | Action | Password Valid | City | State | Country | |
|---|---|---|---|---|---|---|---|
| This is the footer | |||||||

Work With Web Traffic Maps

| ENCRYPTION TOOL | |
|---|---|
| Enter text to encrypt | |
| Encrypted text | |

| CONFIG TOOL | |
|---|---|
| Select property to change | |
| Enter new value | |

Sorry, downloads not available for mobile devices
Retrieving image data...

Network Probabilistic Map
(Dataset Release V.1.0)

Developmental Cognition And
Neuroimaging Lab

ABCD - TEMPLATE MATCHNG PROBABILISTIC ROIs (Dataset Release V.1.0)
0% 10%
Selected Threshold Value:
Note: The dlabel.nii files provided are in CIFTI format
(refer to humanconnectome.org)
some text
Probabilistic Atlas Summary
File Download In Progress...

Please Wait
(this may take a few minutes)
WEBSITE UPDATE
I have already subscribed or I prefer to download without subscribing:
Enter new url:
